

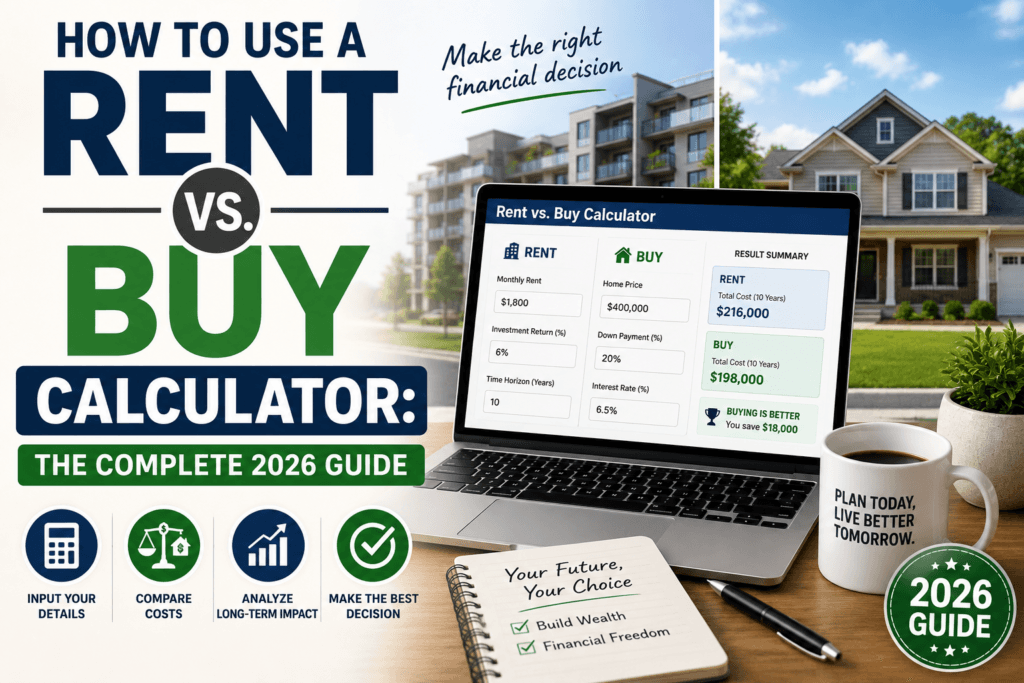
How to Use a Rent vs. Buy Calculator: The Complete 2026 Guide
A step-by-step walkthrough of how to fill out a rent vs. buy calculator correctly, what each input really controls, and how to read the result so you make a housing decision based on numbers — not guesswork.
“Should I rent or should I buy?” is one of the most searched financial questions in the U.S., and for good reason — it’s often the biggest recurring expense decision most people ever make. The honest answer almost never comes down to a gut feeling. It comes down to how long you plan to stay, what mortgage rates look like right now, and how the numbers behave over time.
A rent vs. buy calculator exists to answer exactly that, by comparing the true long-term cost of renting against the true long-term cost of owning — not just the monthly payment, but the whole picture: closing costs, maintenance, property taxes, opportunity cost, and appreciation. This guide walks through exactly how to use one correctly, field by field, so the number it gives you is actually trustworthy.
Lower upfront cost, flexibility, no maintenance responsibility, no equity built.
Upfront costs and maintenance, but builds equity and can be cheaper long-term.
- What a Rent vs. Buy Calculator Actually Does
- Why This Decision Looks Different in 2026
- The Break-Even Point, Explained Simply
- Step-by-Step: How to Use the Calculator
- Understanding Every Input Field
- When Renting Wins vs. When Buying Wins
- Common Mistakes That Skew the Result
- A Full Worked Example
- What the Calculator Can’t Tell You
- Frequently Asked Questions
What a Rent vs. Buy Calculator Actually Does
At its core, a rent vs. buy calculator takes two competing financial paths — staying a renter or becoming a homeowner — and projects the total cost of each one over the same number of years, so you can compare them side by side in real dollars.
For renting, that means your monthly rent, expected rent increases, and what you’d earn if you invested the money you’re not spending on a down payment. For buying, it means your mortgage payment, property taxes, insurance, maintenance, closing costs, and the equity and appreciation you’d build over time. The output isn’t a moral verdict on renting versus owning — it’s a financial one, specific to your numbers, your market, and your timeline.
You can run this comparison with your own numbers using this free Rent vs. Buy Calculator, which does the year-by-year math automatically so you can focus on getting the inputs right — which is where the guide below comes in.
Why This Decision Looks Different in 2026
The rent-or-buy math isn’t fixed — it shifts with the market. A few things worth factoring in right now:
- Mortgage rates directly reshape the break-even point. A higher rate increases your monthly payment and the total interest paid, which pushes out the number of years it takes for buying to beat renting.
- Rent growth varies sharply by city. In some metro areas rents have climbed close to home-price growth, narrowing the gap; in others, rents have stayed relatively flat while home prices haven’t. Using a national average instead of your actual local numbers can badly skew the result.
- Remote and hybrid work has loosened the “buy where you work” assumption. More people are comparing rent vs. buy across multiple cities rather than just their current one.
- Insurance and property tax costs have risen in many states. These are easy to underestimate and can meaningfully change the ownership side of the comparison.
None of this means the calculator is less useful — it means the inputs deserve current, local numbers rather than assumptions from a few years back.
The Break-Even Point, Explained Simply
Almost every rent vs. buy calculator centers on one key output: the break-even point — the number of years you’d need to stay in the home before buying becomes cheaper than renting.
Here’s the intuition: buying has high upfront costs (down payment, closing costs) that renting doesn’t. Those costs need time to be “paid off” through the combination of equity growth, appreciation, and avoiding rising rent. If you sell or move before that break-even point, renting was very likely the cheaper choice. If you stay well past it, buying usually wins by a wide margin.
Step-by-Step: How to Use the Calculator
Enter your current or expected monthly rent
Use your actual rent for your current apartment or home size, or a realistic estimate for the type of home you’d otherwise rent instead of buying.
Add expected annual rent increases
Check what rents have actually done in your specific city over the last few years rather than guessing. A 3% national average can be far off in either direction locally.
Enter the home purchase price you’re evaluating
Use a realistic price for the type of home you’d actually buy, not the top of your pre-approval range.
Add your down payment and mortgage rate
These two numbers drive your monthly payment more than any other input, so use your actual quoted rate rather than a rough guess when possible.
Include property taxes, insurance, and HOA fees
These recurring ownership costs are easy to forget and often add hundreds of dollars a month on top of the mortgage payment itself.
Add an annual maintenance estimate
A common rule of thumb is roughly 1% of the home’s value per year for upkeep and repairs. Older homes typically run higher.
Set your expected home appreciation and investment return rates
These affect both sides of the comparison — home value growth on the buying side, and what your unused down payment could earn if invested instead, on the renting side.
Set how many years you plan to stay, then read the break-even result
Compare your planned timeline against the calculator’s break-even year to see which side of the decision you land on.
Compare Your Own Numbers
Skip the spreadsheet and see your personalized break-even point between renting and buying in under two minutes.
Open the Rent vs. Buy Calculator →Understanding Every Input Field
Monthly rent and annual rent growth
This sets the entire cost baseline on the renting side. Because rent compounds every year, even a 1-point difference in your growth assumption can shift the long-term comparison meaningfully over a 10-year horizon.
Home price, down payment, and mortgage rate
These three together determine your loan amount and monthly principal-and-interest payment. A larger down payment lowers your monthly payment but also ties up more cash that could otherwise be invested — which is exactly the tradeoff the calculator is built to weigh.
Property taxes, insurance, and HOA
These vary enormously by state and city. Pulling your actual local property tax rate rather than a national average will make a real difference in accuracy.
Maintenance costs
Ongoing upkeep is one of the most commonly skipped inputs, but it’s a real and recurring cost of ownership that renters simply don’t have.
Home appreciation rate
This should reflect realistic, long-run local trends rather than the best year your market has ever had. Overly optimistic appreciation assumptions are one of the most common ways this calculation gets skewed toward buying.
Investment return on the down payment
This represents what the money you’d otherwise use for a down payment could earn if invested instead — a factor renters have and buyers give up. It’s often overlooked, but it materially affects the comparison.
When Renting Wins vs. When Buying Wins
| Situation | Renting Often Wins | Buying Often Wins |
|---|---|---|
| Time horizon | Staying under 3–5 years | Staying 7+ years |
| Local market | High home prices relative to rent | Rent close to or above mortgage cost |
| Mortgage rates | Rates are elevated | Rates are low or you can buy down the rate |
| Career stage | Expecting a relocation or job change | Settled long-term in the area |
| Cash position | Limited savings for a down payment and reserve fund | Strong savings beyond the down payment for repairs |
Common Mistakes That Skew the Result
- Comparing only the monthly payment. A mortgage payment alone ignores taxes, insurance, and maintenance — the true monthly cost of owning is almost always higher than principal and interest.
- Using an unrealistically high appreciation rate. This artificially shortens the break-even point and can make buying look better than it really is.
- Forgetting closing costs. Buying typically comes with several percent of the purchase price in closing costs, which meaningfully delays the break-even point.
- Ignoring what the down payment could otherwise earn. This “opportunity cost” is one of the most overlooked factors and directly strengthens the renting side of the comparison.
- Using national averages instead of local numbers. Rent growth, appreciation, property taxes, and insurance all vary widely by city — local data always produces a more trustworthy result.
A Full Worked Example
Here’s how the comparison plays out for a hypothetical household evaluating a $380,000 home versus a $2,100/month rental, planning to stay 8 years.
- Home price$380,000
- Down payment (10%)$38,000
- Mortgage rate6.4%
- Property tax + insurance (monthly)$610
- Estimated maintenance (annual)$3,800
- Comparable monthly rent$2,100
- Assumed rent growth / home appreciation3.5% / 3.5%
- Calculated break-even point~6.2 years
Because this household plans to stay 8 years — beyond the roughly 6.2-year break-even point — buying comes out ahead in this scenario. If their planned stay dropped to 3–4 years instead, renting would likely be the cheaper path once closing costs and near-term appreciation are factored in.
What the Calculator Can’t Tell You
The math is only part of the decision. A few things worth weighing alongside the number:
- Flexibility. Renting makes it far easier to relocate for a job, a relationship, or a lifestyle change without the cost and time of selling a home.
- Stability of housing costs. A fixed-rate mortgage locks in your principal-and-interest payment, while rent can rise every lease renewal.
- Maintenance responsibility and time. Owning means you handle repairs yourself, which is a real time and stress cost the calculator doesn’t capture.
- Emotional and lifestyle value. Space to renovate, put down roots, or simply the psychological comfort of ownership matters to many people beyond what the spreadsheet shows.
Use the calculator’s break-even point as the financial half of the decision, then weigh it against these non-financial factors before deciding.
More Free Financial & Everyday Tools
The rent vs. buy calculator is one of many free tools built to make big decisions easier — from budgeting to retirement planning and beyond.
Browse All Tools →Frequently Asked Questions
It depends on your local market and mortgage rate, but the break-even point commonly falls between 3 and 7 years. Below that break-even year, renting is usually the cheaper path; well beyond it, buying tends to win clearly.
A well-built calculator should let you enter closing costs as part of the upfront cost of buying, since they meaningfully delay the break-even point and are easy to forget if left out.
No. Renting pays for housing and flexibility, and any money not tied up in a down payment can be invested elsewhere. Whether that beats ownership financially depends entirely on your timeline, local price-to-rent ratio, and mortgage rate.
Use a current average rate for your credit profile and loan type as a starting estimate, then re-run the calculator once you have an actual quote, since even a half-point difference can shift the break-even point by a year or more.
Yes, if the home you’re evaluating has one. HOA fees are a recurring ownership cost, just like property taxes and insurance, and leaving them out understates the true monthly cost of buying.
Yes. Running the calculator separately with each city’s typical rent, home prices, property tax rate, and local appreciation trends is a practical way to compare the rent-vs-buy math across locations you’re considering.
Final Thoughts
The rent-or-buy decision doesn’t have a universal right answer — it has a right answer for your specific numbers, market, and timeline. A rent vs. buy calculator turns a decision that’s often made on instinct into one backed by an actual break-even point you can plan around. Use current, local numbers wherever possible, factor in the costs that are easy to forget, and weigh the result alongside the non-financial parts of the decision that matter to you.
Ready to see where you land? Run the Rent vs. Buy Calculator with your real numbers, or explore the rest of the free online tools built to make everyday financial decisions simpler.
Disclaimer: This article is for general educational purposes only and does not constitute financial, real estate, or tax advice. Individual circumstances vary — consider speaking with a licensed financial advisor or mortgage professional before making a home buying decision.