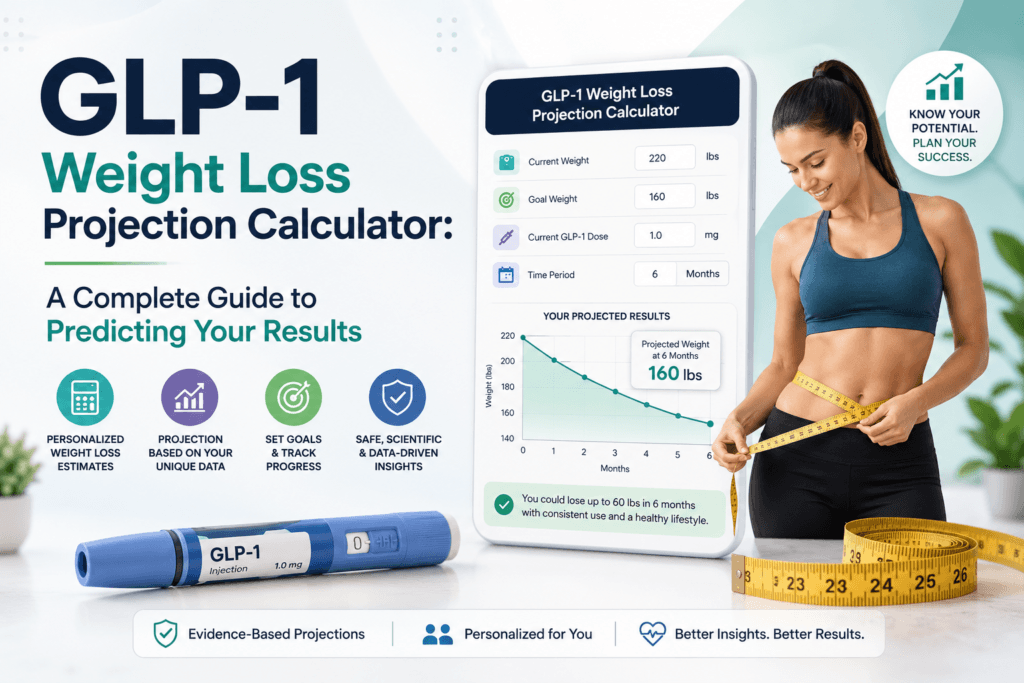
GLP-1 Weight Loss Projection Calculator: A Complete Guide to Predicting Your Results
Medically-informed guide, last reviewed June 2026
If you've started — or you're thinking about starting — a GLP-1 medication like Ozempic, Wegovy, Mounjaro, or Zepbound, you've probably typed some version of this into Google at 11 p.m.: "How much weight will I actually lose?"
It's the single most common question in the GLP-1 community, and honestly, it's a fair one. Your doctor can tell you the clinical trial averages, but averages don't tell you what you can expect based on your starting weight, your dose, your medication, and your timeline. That's exactly the gap our free GLP-1 Weight Loss Projection Calculator was built to close.
This guide walks you through everything the calculator does, the science behind the numbers, what really drives results week by week, and how to set expectations that are realistic instead of discouraging. No fluff, no exaggerated marketing claims — just a straightforward breakdown written for people who are actually on this journey or seriously considering it.
A quick way to think about it: A GLP-1 projection isn't like a GPS giving you a precise arrival time — it's closer to a road trip planner that tells you the route, the rest stops, and roughly when you'll hit traffic. You'll still hit a few unexpected detours along the way (a stressful month, a missed dose, a stubborn week where the scale barely moves), but you'll know they're normal instead of mistaking them for wrong turns.
Table of Contents
- What Is a GLP-1 Weight Loss Projection Calculator?
- How the Calculator Works (And What It's Based On)
- Understanding GLP-1 Medications: Ozempic, Wegovy, Mounjaro, Zepbound
- Week-by-Week: What Weight Loss Actually Looks Like
- The Six Factors That Change Your Personal Projection
- Semaglutide vs. Tirzepatide: Which One Produces Faster Results?
- Why Your Real Results Might Differ From the Calculator
- How to Use Your Projection to Set Realistic Goals
- Common Mistakes People Make When Reading Their Projection
- Frequently Asked Questions
- Try the Calculator + More Free Tools
1. What Is a GLP-1 Weight Loss Projection Calculator?
A GLP-1 weight loss projection calculator is a planning tool that estimates how your body weight is likely to change over time while you're on a GLP-1 receptor agonist medication. Instead of giving you one flat percentage (the way most articles do — "you'll lose 15% of your body weight"), a good projection tool factors in your starting weight, height, age, sex, chosen medication, and current dosing stage to generate a personalized, week-by-week curve.
Think of it less like a promise and more like a weather forecast. It won't be perfect down to the pound, but it gives you a grounded, data-informed picture of the road ahead instead of guessing blind or comparing yourself to someone else's before-and-after photos on social media.
Our GLP-1 Weight Loss Projection Calculator was built specifically to solve three problems we kept seeing in existing tools:
- Most calculators give a single end-number instead of a realistic timeline.
- Very few account for the difference between semaglutide-based medications and tirzepatide-based medications, even though the dosing curves are quite different.
- Almost none explain why the number is what it is, which leaves people confused or anxious when their real-world results don't match.
We built ours to fix all three.
2. How the Calculator Works (And What It's Based On)
When you enter your details into the tool, it doesn't just apply a flat percentage to your current weight. Here's the actual logic running behind the scenes:
Step 1 — Baseline establishment. The calculator takes your current weight, height, age, and sex to establish your starting metabolic profile and your BMI category, since people starting at a higher BMI typically see larger absolute (pound) losses even when the percentage loss is similar.
Step 2 — Medication and dose-curve mapping. Each GLP-1 medication has its own FDA-outlined titration schedule (the gradual dose increase used to minimize nausea and other side effects). The calculator maps your selected medication onto its known titration timeline, because weight loss doesn't happen at a constant rate — it accelerates once you reach a therapeutic dose and tends to plateau as your body approaches a new equilibrium.
Step 3 — Non-linear curve modeling. Real-world and clinical data both show that GLP-1 weight loss follows an S-curve, not a straight line: slower in the first few weeks during dose titration, fastest during months two through six once the maintenance dose kicks in, and then gradually leveling off as your body adjusts. The calculator models this curve instead of just dividing total expected loss by the number of weeks.
Step 4 — Personalized output. You receive a projected week-by-week trajectory, an estimated date to reach your goal weight, and a visual chart showing how your loss is likely to taper.
This approach is grounded in patterns observed across major obesity-medicine clinical research, not a single arbitrary formula — which is why your projection looks like a realistic curve and not a straight diagonal line.
3. Understanding GLP-1 Medications: Ozempic, Wegovy, Mounjaro, Zepbound
It helps to actually understand what these medications do before you look at a number on a screen. GLP-1 stands for glucagon-like peptide-1, a hormone your gut naturally produces after eating. It signals your brain that you're full, slows down how quickly food leaves your stomach, and helps regulate blood sugar.
GLP-1 receptor agonist medications mimic this hormone at a much stronger, sustained level than your body produces on its own. That's the entire mechanism behind the appetite reduction people describe — it's not willpower, it's biology.
Here's a plain-language breakdown of the major medications:
| Medication | Active Ingredient | Originally Approved For | Mechanism |
|---|---|---|---|
| Ozempic | Semaglutide | Type 2 diabetes | GLP-1 receptor agonist |
| Wegovy | Semaglutide (higher dose) | Chronic weight management | GLP-1 receptor agonist |
| Mounjaro | Tirzepatide | Type 2 diabetes | Dual GLP-1/GIP receptor agonist |
| Zepbound | Tirzepatide (weight-management labeling) | Chronic weight management | Dual GLP-1/GIP receptor agonist |
The key distinction worth understanding: tirzepatide-based medications (Mounjaro, Zepbound) activate two hormonal pathways — GLP-1 and GIP (glucose-dependent insulinotropic polypeptide) — while semaglutide-based medications (Ozempic, Wegovy) act on GLP-1 alone. This dual mechanism is generally why tirzepatide tends to produce somewhat greater average weight loss in head-to-head research, though individual response still varies enormously from person to person.
Important: Ozempic and Mounjaro are FDA-approved for type 2 diabetes management. Their use for weight loss alone is considered off-label unless prescribed under specific clinical circumstances. Wegovy and Zepbound carry weight-management indications. Always confirm with your prescribing provider which medication and dosing approach is appropriate for your health profile.
4. Week-by-Week: What Weight Loss Actually Looks Like
One of the biggest sources of frustration in the GLP-1 community comes from unrealistic week-to-week expectations. Here's a general pattern based on how these medications are titrated and how the body typically responds:
Weeks 1–4 (Starting dose): This is the introduction phase. Your body is adjusting to the medication, and most people experience mild appetite suppression along with possible nausea or digestive changes. Weight loss in this window tends to be modest — often water weight and early appetite-driven calorie reduction.
Weeks 5–12 (Titration phase): As your dose increases according to your prescribed schedule, appetite suppression becomes more noticeable and consistent. This is typically when people start to see steadier week-over-week loss.
Months 3–6 (Maintenance dose, peak velocity): Once you reach your therapeutic maintenance dose, this is generally the window where weight loss is fastest and most consistent for most patients.
Months 6–12+ (Plateau approach): As your body approaches a new physiological set point, the rate of loss naturally slows. This is expected and is not a sign that the medication has "stopped working" — it's the same biological pattern seen consistently across long-term clinical research.
Months 12+ (Maintenance): Many patients shift focus from active weight loss to maintaining their results, often at a steady, lower dose alongside nutrition and strength-training habits.
This is exactly the curve our calculator is designed to visualize for your specific numbers, rather than handing you one flat estimate that ignores how titration actually works.
Two Illustrative Scenarios (Hypothetical, Not Actual Patients)
To make this less abstract, here are two simplified, illustrative profiles showing how the same medication can produce a different-shaped curve depending on starting point. These are hypothetical examples for educational purposes only, not real patient data.
Scenario A — Higher starting weight, semaglutide. A person starting at a higher body weight typically sees a steeper drop in absolute pounds during months two through five, simply because a larger starting mass tends to respond with bigger numeric losses even at a similar percentage rate. Their curve on the calculator tends to look like a sharper early slope that gradually flattens.
Scenario B — Closer-to-goal starting weight, tirzepatide. A person who starts closer to their goal weight often sees a gentler, steadier slope rather than a dramatic early drop, since there's simply less excess weight for the same percentage-based loss to act on. Their curve tends to look more linear and less dramatic in the first two months, even though the underlying percentage loss may end up comparable.
Neither pattern is "better" — they're just different shapes of the same underlying biology. This is precisely why a flat, one-size-fits-all percentage is misleading, and why our calculator generates a shape specific to your own starting numbers instead of reusing someone else's curve.
5. The Six Factors That Change Your Personal Projection
No calculator — ours included — can predict your results with perfect accuracy, because weight loss on GLP-1 medications is influenced by more than just the drug itself. Here are the six biggest variables:
1. Starting weight and BMI. People starting at a higher body weight often lose more in absolute pounds, even when the percentage of body weight lost is comparable to someone starting lighter.
2. Medication and dose. Higher maintenance doses are generally associated with greater average weight loss, though higher doses also typically mean a greater chance of side effects — more isn't automatically better for everyone.
3. Diet quality. GLP-1 medications reduce how much you want to eat, but they don't control what you eat. Adequate protein intake (commonly cited around 0.6–0.8 grams per pound of body weight) is one of the most important levers for preserving muscle mass while losing fat.
4. Physical activity, especially resistance training. Strength training two to three times per week is consistently linked to better body composition outcomes — meaning more of the weight lost comes from fat rather than lean muscle.
5. Consistency and adherence. Missed doses, inconsistent timing, or stopping and restarting the medication can all disrupt the steady trajectory the calculator projects.
6. Underlying metabolic conditions. Conditions like type 2 diabetes are associated with somewhat slower average weight loss on GLP-1 medications compared to people without diabetes, based on patterns observed across major obesity trials.
6. Semaglutide vs. Tirzepatide: Which One Produces Faster Results?
This is one of the most-searched comparisons in the entire GLP-1 space, so let's address it directly and honestly.
Across large-scale clinical research comparing the two drug classes, tirzepatide-based medications have generally shown somewhat greater average weight loss compared to semaglutide-based medications at their respective maximum doses. The dual-hormone mechanism (GLP-1 + GIP) appears to provide an added metabolic effect beyond GLP-1 activation alone.
That said, "greater on average" does not mean "better for everyone." Some patients respond more strongly to semaglutide, tolerate it better, or have insurance coverage that makes it the more accessible option — which, practically speaking, often matters more than a few percentage points of projected difference. Tirzepatide also tends to come with a somewhat different side-effect tolerance profile for some patients, partly due to its shorter half-life and different titration schedule.
The honest answer: the "best" medication is the one your prescribing provider determines is appropriate for your health history, that you can access consistently, and that you tolerate well enough to stay on long-term — because consistency is a bigger driver of real-world results than the small average difference between the two drug classes.
7. Why Your Real Results Might Differ From the Calculator
We want to be transparent about this, because too many tools online oversell precision they don't actually have. Your projection is built on population-level patterns from people with similar starting characteristics — it is not a guarantee of your individual outcome.
Reasons your real trajectory might move faster or slower than the projection:
- Your individual metabolic rate and hormonal profile are unique to you.
- Genetics influence how strongly your body responds to GLP-1 receptor activation.
- Sleep quality and chronic stress both affect appetite-regulating hormones (cortisol and ghrelin in particular), which can blunt or amplify medication effects.
- Concurrent medications or health conditions can interact with your response.
- Dose adjustments made by your provider based on tolerability will shift your actual curve away from a "standard" titration schedule.
Use the projection as a planning compass, not a finish-line guarantee. It's most useful for setting realistic month-by-month expectations and noticing early if your real progress is significantly off-track, which is a good prompt to check in with your prescribing provider.
8. How to Use Your Projection to Set Realistic Goals
Here's a practical way to actually use the calculator output instead of just glancing at the number once:
- Run the projection before you start, so you have a realistic benchmark rather than expectations shaped by social media transformation posts.
- Re-check it every 4–6 weeks against your actual weight, not every single day — daily fluctuations from water retention, hormones, and digestion are normal and not meaningful on their own.
- Focus on the trend line, not single data points. If your actual weight loss is broadly tracking the curve's shape (even if the exact numbers differ slightly), you're on a normal trajectory.
- Use the plateau phase as a signal to adjust habits, not panic. When you reach the part of the curve where loss naturally slows, that's the moment to revisit protein intake, strength training, and sleep — not necessarily dose increases.
- Bring your projection chart to provider appointments. It gives you and your doctor a shared, objective reference point for discussing whether your treatment plan needs adjusting.
9. Common Mistakes People Make When Reading Their Projection
- Comparing their curve to someone else's anecdote online. Reddit and TikTok transformation stories are real, but they're also self-selected for dramatic results — they're not a representative sample.
- Expecting a straight diagonal line instead of an S-curve. Slower weeks during titration and during the plateau phase are normal, expected parts of the process, not failures.
- Ignoring the role of diet and movement entirely. The projection assumes reasonably consistent habits; it isn't modeling someone eating in a significant calorie surplus.
- Treating the calculator as medical advice. It's an educational planning tool. It cannot replace bloodwork, a physical exam, or an actual conversation with a licensed healthcare provider about your specific case.
10. Frequently Asked Questions
How accurate is a GLP-1 weight loss projection calculator? A well-built calculator is accurate at the population level — meaning it reflects realistic patterns seen across many patients with similar starting weights, medications, and dosing schedules. It cannot predict your exact individual outcome, since personal biology, adherence, and lifestyle habits all influence the final result.
How much weight can I expect to lose on Ozempic or Wegovy? Average outcomes for semaglutide-based medications in long-term obesity research have generally landed in the range of moderate-to-substantial body weight reduction over roughly a year and a half of consistent use, with the largest portion of that loss occurring in the first six to eight months at the maintenance dose. Individual results vary considerably.
Is Mounjaro or Zepbound more effective than Ozempic or Wegovy? On average, tirzepatide-based medications (Mounjaro, Zepbound) have shown somewhat greater average weight loss compared to semaglutide-based medications (Ozempic, Wegovy) in large-scale research, largely attributed to their dual-hormone mechanism. However, individual response varies, and the right medication depends on your health profile, tolerability, and your prescribing provider's recommendation.
Why did my weight loss slow down even though I'm still on the medication? This is expected. GLP-1 weight loss naturally follows a curve that decelerates as your body approaches a new physiological equilibrium. A slowing rate of loss is not a sign that the medication has stopped working — it's a normal, well-documented part of the long-term pattern.
Can I use this calculator if I have type 2 diabetes? Yes, but keep in mind that research consistently shows people with type 2 diabetes tend to experience somewhat slower average weight loss on GLP-1 medications compared to people without diabetes. A well-designed calculator should account for this difference in its projection.
Does diet and exercise actually matter if the medication is suppressing my appetite? Significantly, yes. The medication reduces how much you want to eat, but what you eat during that reduced intake determines whether you're losing primarily fat or losing a meaningful amount of muscle along with it. Adequate protein and resistance training are two of the most evidence-supported ways to protect lean mass during GLP-1-assisted weight loss.
Is this calculator a substitute for medical advice? No. This tool is designed for education and planning purposes only. It does not replace a consultation with a licensed healthcare provider, who can evaluate your full medical history, run appropriate labs, and determine the medication and dosing plan that's right for you.
11. Try the Calculator + More Free Tools
If you've read this far, you understand the "why" behind the numbers far better than the average person typing a quick search query — which means you're in a much stronger position to actually use a projection tool well instead of just staring at one final number.
Ready to see your own personalized week-by-week trajectory? Try our free GLP-1 Weight Loss Projection Calculator — enter your starting details, choose your medication, and get a realistic visual timeline built around the same titration and curve logic explained in this guide.
And if you're working on other parts of your health and planning journey, browse our full library of free online tools — from calculators to everyday planning utilities, all free to use, no sign-up required.
This article is for educational and informational purposes only and is not a substitute for professional medical advice, diagnosis, or treatment. GLP-1 medications are prescription-only and should only be started, stopped, or adjusted under the guidance of a licensed healthcare provider. Always consult your doctor before beginning any weight-management treatment.