

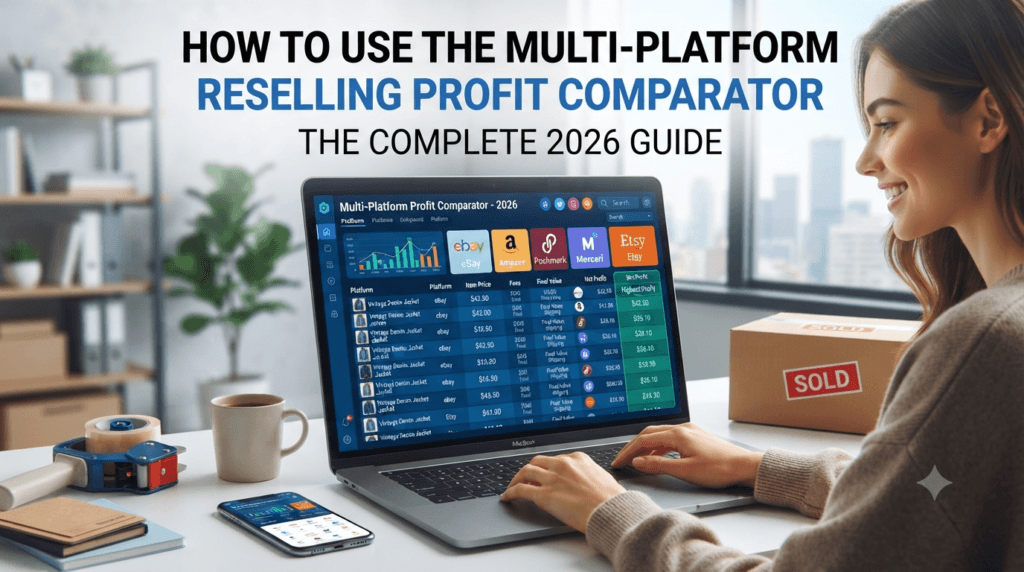
How to Use the Multi-Platform Reselling Profit Comparator: The Complete 2026 Guide
A step-by-step walkthrough for turning guesswork into an exact profit number before you ever hit “list” — across eBay, Poshmark, Mercari, Depop, and Facebook Marketplace.
On this page
- What the Profit Comparator actually does
- Why “just picking a platform” is costing you money
- How to use it, step by step
- A full worked example, line by line
- Typical fee structures by platform
- Advanced strategies for maximizing net profit
- Scenarios where the “best platform” changes
- Mistakes that quietly eat reseller margins
- Who should be using this tool
- FAQ
If you buy an item once and sell it on five different platforms in your head, you’ll get five different profit numbers — and only one of them is real. The Multi-Platform Reselling Profit Comparator is a free calculator that takes a single item’s cost, shipping, and asking price, then runs it through every major marketplace’s actual fee structure at once, so you see net profit — not gross revenue — side by side before you list anything.
That distinction matters more in 2026 than it ever has. Selling fees, payment processing cuts, promoted-listing costs, and return-shipping exposure vary widely from platform to platform, and they change often enough that a fee you memorized last year may no longer be accurate. This guide walks through exactly how to use the tool, why the numbers it produces differ from your gut feeling, and how experienced resellers fold it into a repeatable pricing workflow.
What the Profit Comparator Actually Does
At its core, the tool answers one question: “If I sell this exact item on Platform A versus Platform B versus Platform C, which one actually puts more money in my pocket?” It does that by applying each marketplace’s selling fee, payment processing fee, and — where relevant — shipping-label cost and promotional-fee assumptions to your item’s numbers in a single pass.
Instead of opening four browser tabs, half-remembering each platform’s fee percentage, and doing mental math that ignores rounding and minimum fees, you enter your numbers once. The comparator returns a clean, ranked breakdown of net profit and profit margin per platform, so the “best” venue for that specific item becomes an objective answer instead of a hunch.
Why “Just Picking a Platform” Is Costing You Money
Most new resellers choose a platform based on habit, not math. They list everything on the app they downloaded first, and that “default platform” tax quietly compounds across hundreds of items a year. A pair of sneakers that nets $28 in profit on one marketplace might net $19 on another once you account for the payment processing fee, the buyer-paid shipping subsidy you had to eat, and a slightly higher category commission.
Multiply a $9 gap by 300 items sold annually and you’re looking at over $2,700 left on the table — not from bad sourcing, but from listing in the wrong place. This is the exact gap a high-intent search like “which resale platform has the lowest fees for clothing” or “best place to sell sneakers online 2026” is really trying to close, and it’s precisely what the comparator is built to answer on an item-by-item basis rather than as a generic blog-post average.
Fee structures also aren’t static. Marketplaces adjust seller fees, introduce new promoted-listing tiers, or change free-shipping thresholds throughout the year. A comparison you memorized twelve months ago can quietly become wrong. Recalculating per item — rather than relying on memory — is the single habit that separates resellers who treat this as a business from those who treat it as a hobby.
How to Use the Multi-Platform Reselling Profit Comparator — Step by Step
The workflow below is the exact sequence to run for every item before it goes live, whether you’re pricing a single vintage jacket or batch-checking a sourcing haul of forty items.
Open the comparator and enter your item cost
Start at the Multi-Platform Reselling Profit Comparator and enter what you actually paid for the item — thrift price, wholesale unit cost, or auction hammer price. Include tax paid at acquisition if you track landed cost; leaving it out will inflate every profit figure that follows.
Set your intended sale price
Enter the price you plan to list at — not a hoped-for price, the number you’d actually publish today based on recent sold comps. Garbage-in pricing produces a technically correct but practically useless comparison.
Add shipping cost and who pays it
Input your actual shipping cost and specify whether the buyer or seller covers it. This single field is where most manual math falls apart, since “free shipping” listings still cost the seller the label price out of the sale.
Select the platforms you want to compare
Toggle on the marketplaces you actually have active seller accounts on. There’s little value in comparing a platform you’re not set up to sell on yet.
Review the ranked net-profit breakdown
The tool returns each platform’s estimated selling fee, payment processing fee, net profit in dollars, and profit margin as a percentage — ranked from highest to lowest so the best-fit platform is immediately obvious.
Sanity-check against sell-through speed
The highest-margin platform isn’t automatically the right choice if that item historically sits unsold for months there. Weigh the profit number against how fast that category actually moves on each marketplace before committing.
List, then re-run if you reprice
If you drop the price after a week of no interest, re-run the comparison. A lower sale price can shift which platform is actually most profitable once minimum fees and flat processing costs are factored back in.
A Full Worked Example, Line by Line
Here’s how this looks on a real item: a lightly-used designer handbag sourced at an estate sale for $40, priced to sell at $150, with an $12 shipping label the seller covers as part of a “free shipping” listing.
Run that exact same $40-cost, $150-price, $12-shipping item through a different marketplace with a lower flat commission but a higher payment-processing cut, and the net profit can land several dollars lower or higher — often enough to flip which platform is genuinely “best” for that item. That’s the entire value of comparing before you list: the gap is invisible until you calculate it, and it’s different for every single item because fee tiers, category commissions, and processing rates don’t scale identically with price.
Typical Fee Structures by Platform (What the Comparator Accounts For)
Every major resale marketplace charges some combination of a selling fee (usually a percentage of the total sale, including shipping in some cases), a payment processing fee, and occasionally a listing or subscription fee. The table below shows the categories of fees the comparator factors in — always check the tool for current live rates, since platforms revise fee schedules periodically.
| Fee type | What it typically covers | Why it changes your numbers |
|---|---|---|
| Final value / selling fee | A percentage of the sale, sometimes including shipping | Usually the single largest deduction; varies by category and seller level |
| Payment processing fee | Card/payment network cost per transaction | Often a flat rate plus a small per-order fee that hurts low-priced items more |
| Shipping label cost | Cost of the label if the seller offers “free shipping” | A fixed dollar cost that shrinks margin more on cheaper items proportionally |
| Promoted listing / ad fee | Optional visibility boost, charged as a percentage on sale | Can be worth it for slow-moving inventory but changes net profit if used |
| Subscription / store fee | Monthly or annual seller-tier cost | Amortized cost that matters more for high-volume sellers than casual ones |
Advanced Strategies for Maximizing Net Profit Across Platforms
Once the basic workflow is a habit, these are the refinements that separate resellers pulling consistent five-figure side income from those who plateau.
- Batch-compare by category, not just by item. Run three or four representative items from a new sourcing category (say, women’s denim versus vintage band tees) through the comparator once, then apply the winning platform pattern to the rest of that batch rather than re-checking every single unit.
- Factor in return risk, not just fees. A platform with a slightly lower selling fee but a much higher return rate for a given category can still be the worse net choice — the comparator’s dollar output is the starting point, but categories with high return exposure deserve a manual haircut to the profit estimate.
- Recheck high-ticket items before every relist. On items over roughly $200, a one- or two-percent fee difference between platforms translates into real dollars, so these are the listings most worth re-running through the tool whenever you reprice.
- Track your break-even price per platform. Use the comparator in reverse by adjusting the sale price until net profit hits zero — that break-even number tells you the true floor price for that item on that specific marketplace, which is invaluable during offer negotiations.
- Bundle low-margin items strategically. Items that show thin or negative margin individually can still be profitable combined into a bundle listing, since flat processing fees and shipping costs get spread across a higher total sale price.
Mistakes That Quietly Eat Reseller Margins
These are the recurring errors we see in seller communities, and every one of them is solved by running the numbers instead of estimating them.
- Ignoring payment processing fees entirely. Sellers often mentally subtract only the headline “selling fee” and forget the separate processing cut, overstating profit on every single sale.
- Treating “free shipping” as free. The seller pays for that label somewhere — leaving it out of the math is the single most common source of surprised, disappointed resellers at tax time.
- Comparing gross revenue instead of net profit. A higher sale price on one platform means nothing if that platform’s combined fee load erases the gap.
- Using last year’s fee percentages from memory. Marketplaces revise fee schedules; a mental shortcut that was accurate a year ago can silently be wrong today.
- Never revisiting the comparison after a price drop. A repriced item can flip which platform is most profitable, especially near flat-fee thresholds.
Long-Tail Scenarios Where the “Best Platform” Actually Changes
A handful of recurring situations show up again and again in reseller communities, and each one is a case where relying on a general rule instead of the comparator leads sellers to leave money on the table.
- Low-price, high-volume items under $20. Flat payment-processing fees hit these hardest as a percentage of sale price, so the platform with the lowest advertised commission isn’t always the one with the best net outcome once processing is included.
- Heavy or oversized items with expensive shipping. When a shipping label costs more than the platform’s selling fee, the marketplace with better negotiated shipping rates or higher buyer-paid-shipping norms can outperform a “lower fee” competitor by a wide margin.
- Items priced right at a platform’s free-shipping threshold. Sliding a price a few dollars above or below a stated threshold can change who absorbs the shipping cost, which is easy to miss without recalculating.
- High-ticket items where promoted listings are tempting. An optional ad fee can look small as a percentage but meaningfully change which platform produces the higher net dollar amount once it’s toggled on for a slow-moving expensive item.
- Cross-border or multi-currency sales. Currency conversion and international fee tiers add another layer that’s easy to underestimate mentally but straightforward to compare directly.
None of these scenarios require a different tool or a spreadsheet built from scratch — they’re the same core inputs (cost, price, shipping) run through the comparator with attention to which fields actually shift the outcome for that specific case.
Who Should Be Using This Tool
The comparator is built for anyone who sells the same category of item across more than one marketplace, including part-time closet cleaners deciding between Poshmark and Facebook Marketplace, full-time thrift-to-resale flippers listing simultaneously on eBay and Mercari, small vintage boutiques cross-listing to Depop and Etsy, and sneaker or streetwear resellers weighing specialty marketplaces against general ones. If you’ve ever asked yourself “where should I actually list this?” — that’s the exact moment to run it through the tool rather than guess.
Compare Your Next Listing in Under a Minute
Stop guessing which marketplace pays you more. Enter your item once and see net profit ranked across every platform you sell on.
Open the Profit Comparator →Frequently Asked Questions
Is the Multi-Platform Reselling Profit Comparator free to use?
Yes. The tool is free and doesn’t require creating an account — you enter item cost, sale price, and shipping, and it returns a ranked net-profit breakdown instantly.
Which resale platform has the lowest fees overall?
There isn’t one universal answer — the lowest-fee platform depends on the item’s category, price point, and whether shipping is buyer- or seller-paid. That’s exactly why a per-item comparison beats a general “platform X is cheapest” rule of thumb.
Does the comparator include payment processing fees, not just selling fees?
Yes. Selling fees alone tell an incomplete story, so the tool layers in typical payment processing costs to produce a realistic net-profit figure rather than an inflated gross estimate.
Can I use this tool for bulk or batch sourcing hauls?
Yes. Run a few representative items from each category in a haul through the comparator to identify the best-performing platform for that category, then apply the pattern across similar items instead of checking every single unit individually.
How often should I re-run the comparison for the same item?
Re-run it any time you change the sale price, switch shipping arrangements, or after a platform announces a fee update — small changes near flat-fee thresholds can shift which marketplace is actually most profitable.
Where can I find other free tools for resellers?
Toolriz maintains a full library of free calculators and utilities beyond the profit comparator — browse the complete collection on the Toolriz online tools page.
The Bottom Line
Profit isn’t what you sold something for — it’s what’s left after every fee, label, and processing cut takes its share, and that number is different on every marketplace for every item. Building the habit of running each listing through the Multi-Platform Reselling Profit Comparator before you publish it turns pricing from a guess into a decision backed by actual numbers, and over hundreds of listings a year, that habit is worth real money. Pair it with the rest of the free calculators on the Toolriz tools page to round out a data-driven reselling workflow for 2026 and beyond.